

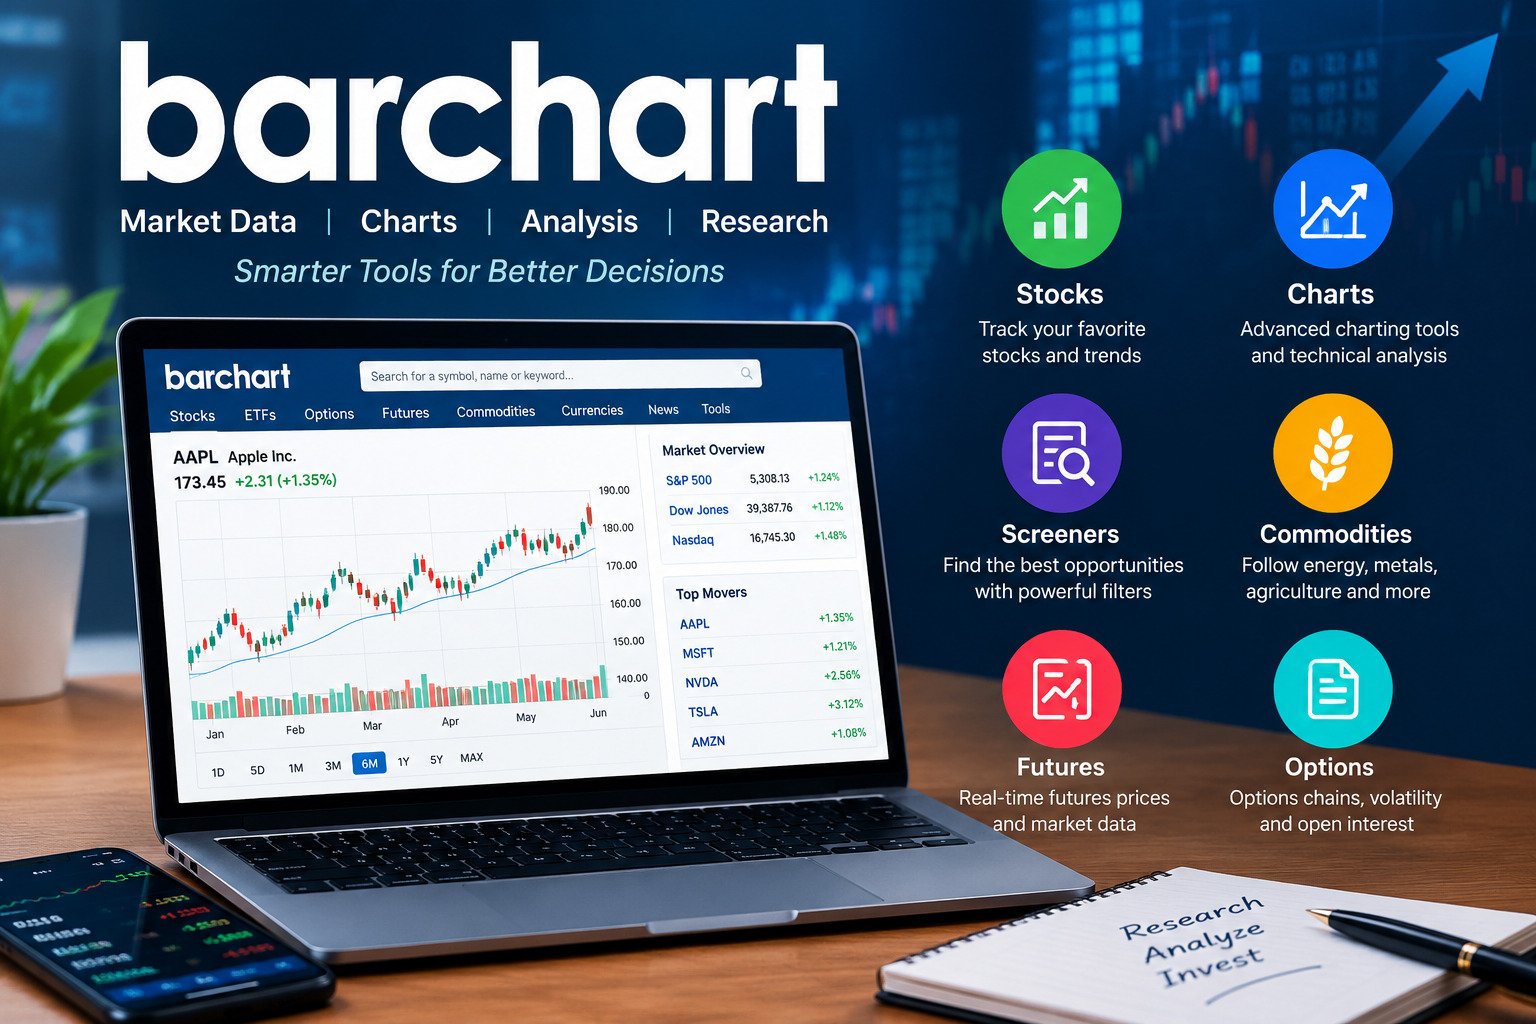
Introduction to Barchart
In today’s fast-moving financial world, access to reliable market information is essential for investors, traders, and anyone interested in understanding the stock market. Barchart is a financial market information platform that provides market data, stock charts, technical indicators, futures prices, options information, and analytical tools. By bringing different types of financial information together, the platform helps users research market movements and evaluate potential trading opportunities.
Whether we are monitoring individual stocks, comparing investment options, following commodity prices, or studying futures markets, having access to organized financial data can make the research process more efficient. Barchart serves a broad audience, including beginners who want to understand market trends and experienced traders who need more detailed analytical resources.
The platform covers multiple asset classes, allowing users to explore equities, exchange-traded funds (ETFs), options, futures, currencies, and commodities. Its combination of market summaries, interactive charts, screening tools, and financial news makes it a useful starting point for market research.
Understanding how Barchart works, what tools it offers, and how to interpret its information can help us make better-informed financial decisions.
What Is Barchart?
Barchart is a financial data and analytics provider that specializes in delivering market information for a variety of financial instruments. It offers resources for tracking prices, examining historical performance, identifying technical patterns, and researching market developments.
One of its main advantages is the range of information available through a single platform. Instead of visiting multiple websites to check stock prices, futures markets, options activity, and commodity trends, users can explore many of these categories through Barchart.
The platform is particularly useful for people who prefer data-driven research. Investors can examine price movements over different periods, while traders can investigate technical indicators and market signals. Commodity market participants can also use its resources to follow agricultural products, energy markets, and metals.
Barchart is not a brokerage by itself in the traditional sense. Its primary purpose is to provide market information and analytical tools rather than replace a regulated broker or financial adviser. Users should distinguish between information that supports investment research and services that actually execute trades.
Key Features of Barchart
1. Stock Market Data
Stock market data is one of the most important features of Barchart. Users can research publicly traded companies, review market prices, and examine changes in share values.
Stock information can help us understand how a company is performing in the market. Price changes, trading volume, historical trends, and related indicators provide useful context when researching an investment.
Investors may use these resources to compare companies within the same industry or monitor stocks they already own. Short-term traders may focus on price fluctuations and trading activity, while long-term investors may examine broader performance trends.
However, a rising stock price does not automatically indicate that a company is financially strong. Market prices can change because of earnings announcements, economic conditions, investor expectations, and unexpected events. Stock data should therefore be considered alongside company fundamentals and relevant news.
2. Interactive Stock Charts
Charts allow users to understand market movements visually. Barchart provides charting resources that help users examine price changes across different time frames.
Depending on the instrument and chart configuration, users can study daily, weekly, monthly, or intraday movements. Common chart types include line charts, bar charts, and candlestick charts.
Candlestick charts are especially popular among technical analysts because they display opening, closing, high, and low prices for a particular period. This information can help users identify trends and observe how buyers and sellers have influenced prices.
Charts may also be used with technical indicators such as moving averages, the Relative Strength Index (RSI), and the Moving Average Convergence Divergence (MACD).
These indicators provide additional ways to examine market behavior, but they are not guaranteed predictors of future prices. A more reliable research process considers several factors instead of relying on a single chart pattern or indicator.
3. Stock Screeners and Market Rankings
Stock screeners are useful tools for narrowing down a large market into a more manageable list of companies. Barchart provides screening resources that allow users to explore stocks according to selected financial and market characteristics.
Depending on the screener and available subscription features, users may be able to filter securities by price, trading volume, performance, market capitalization, technical indicators, and other criteria.
For example, an investor researching established companies might focus on businesses with consistent financial performance. Someone studying market trends might instead compare stocks with different price movements or trading volumes.
The main benefit of screening is efficiency. Rather than examining thousands of companies individually, users can organize their research around specific questions and criteria.
However, screening results should be treated as a starting point, not a final investment decision. A company that meets certain numerical conditions may still have significant financial, operational, or industry-related risks.
4. Futures and Commodities Market Information
Barchart also provides information about futures and commodities markets, which are important to industries such as agriculture, energy, manufacturing, and transportation.
Commodity markets include products such as crude oil, natural gas, gold, silver, wheat, corn, and other agricultural goods. Their prices can respond to supply and demand, weather conditions, geopolitical developments, production costs, and changes in global economic activity.
Futures contracts are agreements to buy or sell an underlying asset at a specified price under defined contractual terms. They are used by commercial businesses for risk management and by market participants for other financial purposes.
Barchart helps users follow futures prices and examine historical market movements. This information can provide useful context for understanding how commodity markets respond to changing conditions.
For example, changes in energy prices can influence transportation and manufacturing costs, while agricultural price movements may affect food producers and supply chains.
It is important to understand that futures are complex financial instruments. Their risks can differ significantly from those of ordinary stock investments, so beginners should focus on learning the underlying concepts before considering participation in these markets.
5. Options Market Research
Options are financial contracts that provide specific rights involving an underlying asset under defined conditions. Barchart offers options-related information that helps users examine contracts, expiration dates, strike prices, trading volume, and volatility measures.
Options data can be difficult to interpret because several variables influence an option’s value. These include the underlying asset’s price, time until expiration, implied volatility, and prevailing interest rates.
Barchart’s options resources can help users organize this information and compare contracts.
One important concept is implied volatility, which reflects the market’s expectations of future price variability as implied by options prices. Higher implied volatility can be associated with more expensive options, although the relationship also depends on other variables.
Another important concept is open interest, which measures the number of outstanding options or futures contracts that have not been closed, exercised, or otherwise settled.
These measures provide useful market context, but neither one guarantees a particular price direction or profitable outcome. Options involve risks that may be difficult for inexperienced investors to assess.
6. Technical Indicators and Market Signals
Technical analysis examines historical prices and trading activity to identify patterns and evaluate market behavior. Barchart’s charting and analytical resources can support this type of research.
Common indicators include:
- Moving averages: Help summarize price movements over a selected period.
- Relative Strength Index (RSI): Measures the strength of recent price movements within a defined range.
- MACD: Compares moving averages to examine changes in momentum.
- Trading volume: Shows the number of shares or contracts traded during a period.
- Support and resistance: Refer to price areas where buying or selling activity has historically influenced market movements.
These tools are useful for organizing observations, but their signals are not infallible. Indicators can produce misleading signals, particularly when markets are volatile or moving sideways.
A balanced analysis combines technical observations with relevant financial information, market conditions, and a clear understanding of uncertainty.
How to Use Barchart for Market Research
Getting started with Barchart is relatively straightforward. We can approach the platform systematically instead of trying to explore every feature at once.
Step 1: Visit the official website. Open Barchart.com and explore its available market categories.
Step 2: Choose an area of interest. Select a category such as stocks, ETFs, futures, commodities, or options, depending on the subject being researched.
Step 3: Search for a financial instrument. Enter a company name or ticker symbol to locate the relevant market information.
Step 4: Review the available data. Examine the price, historical chart, trading volume, and other relevant information. Check the timestamps and whether prices are delayed or real-time.
Step 5: Compare multiple sources. Use company reports, official exchange information, and reputable financial news to verify important details.
Step 6: Record observations. Keep track of the information being researched and distinguish verified facts from assumptions about future market movements.
This process helps us use Barchart as a research resource rather than treating any single metric as a complete explanation of market conditions.
Is Barchart Free to Use?
Barchart offers access to market information and tools, but the availability of individual features depends on the service and subscription level.
Some resources can be accessed without a paid subscription, while advanced analytical tools, customization options, and certain data features may require registration or a premium plan.
Before paying for a subscription, users should review the current pricing, included features, data permissions, and cancellation terms on the official website.
A free account may be sufficient for someone who occasionally checks market prices or researches a few companies. Users with more specialized requirements may want to compare the benefits of paid features against their actual research needs.
We should not assume that a paid plan automatically produces better investment decisions. The value of any subscription depends on whether its tools address a genuine need.
Advantages of Barchart
Barchart offers several benefits for financial research.
Broad market coverage: The platform brings together information on multiple financial asset classes, including stocks, ETFs, futures, commodities, and options.
Convenient charting tools: Visual charts make it easier to examine historical prices and recognize changes in market behavior.
Screening capabilities: Filters can help users narrow large groups of securities according to selected criteria.
Market information in one place: Combining different categories of financial information can reduce the need to switch repeatedly between research websites.
Useful for different experience levels: Beginners can explore basic market information, while experienced researchers may benefit from more advanced analytical features.
Barchart also provides market data and technology solutions for businesses that need financial information for their own digital services.
Limitations to Consider Before Using Barchart
Although Barchart can support financial research, users should understand its limitations.
First, market data may be delayed depending on the instrument, exchange, data package, and subscription. Anyone who requires current prices should verify the applicable data status.
Second, the volume of information can be overwhelming for beginners. Learning how to interpret indicators, options statistics, and futures data takes time.
Third, certain advanced tools may require a paid subscription. Users should evaluate these costs before committing to a plan.
Finally, market information cannot eliminate investment risk. Historical performance does not guarantee future results, and technical indicators cannot reliably predict every market movement.
We should also distinguish educational research from personalized financial advice. Barchart provides information and analytical resources, but users remain responsible for understanding the risks associated with financial decisions.
Barchart vs. Other Financial Research Platforms
Financial websites often overlap in the services they provide, but their strengths and available features can differ.
| Research need | What to compare |
|---|---|
| Stock research | Company financials, stock prices, and historical performance |
| Chart analysis | Available indicators, chart customization, and historical data |
| Options research | Contract details, volatility information, and screening features |
| Commodity research | Futures prices, historical movements, and market coverage |
| Portfolio monitoring | Watchlists, portfolio tools, and available alerts |
| Data access | Update frequency, download options, and subscription restrictions |
The best platform depends on individual research requirements. Some users prioritize simple charts and news, while others need more detailed screening or specialized derivatives data.
Rather than choosing a service solely because it advertises more features, we should determine which information we actually need and assess its accuracy, usability, cost, and limitations.
Who Should Use Barchart?
Barchart can be useful for several groups of people.
Long-term investors may use market data and charts to monitor companies and follow broader market developments.
Financial students and beginners can explore how stock prices, trading volume, and financial indicators work. Beginners should start with educational resources and simulated examples rather than risking money while learning.
Market researchers may use historical data and screening tools to organize information across different securities.
Commodity industry professionals may find futures and commodity information useful for understanding price movements affecting their industries.
Experienced financial analysts may benefit from broader market coverage and specialized analytical resources, depending on their requirements.
The platform’s usefulness ultimately depends on the user’s goals, knowledge, and ability to interpret financial information responsibly.
Tips for Getting More Value From Barchart
To use Barchart effectively, we should begin with a clear research question. Instead of browsing randomly, decide whether the goal is to understand a company’s historical performance, study an industry, or learn how a particular indicator works.
Next, focus on a small number of relevant metrics. Looking at too many indicators simultaneously can create confusion and make it harder to distinguish meaningful information from noise.
We should also verify important figures against reliable sources, especially when researching financial statements, corporate announcements, or time-sensitive prices.
Maintaining a research journal can help record observations, explain the reasoning behind conclusions, and identify mistakes in interpretation.
Finally, we should continue learning the fundamentals of financial markets. Understanding diversification, volatility, liquidity, and risk can be more valuable than simply collecting additional indicators.
Frequently Asked Questions About Barchart
1. What is Barchart used for?
Barchart is used to research financial markets, view stock charts, monitor prices, explore futures and commodities, examine options data, and use analytical tools for market research.
2. Is Barchart free?
Some information and tools are available without payment, while other features may require a subscription. Current plan details should be checked on the official website.
3. Is Barchart suitable for beginners?
Yes, beginners can use Barchart to learn about stock prices, charts, and market data. Starting with basic concepts and educational material is recommended because advanced options and futures information can be complex.
4. Does Barchart provide real-time stock prices?
Data availability depends on the instrument, exchange, and subscription. Some information may be delayed, so users should check the displayed timestamps and applicable data terms.
5. Can Barchart help with stock research?
Yes. Its charts, market information, and screening tools can help users organize stock research. However, these tools cannot guarantee investment returns or predict future prices with certainty.
6. Does Barchart cover commodities?
Yes. Barchart provides information on commodity markets, including agricultural products, energy, and metals, as well as related futures data.
7. Is Barchart a brokerage?
Barchart primarily provides financial data, market information, and analytical tools. It should not be confused with a brokerage that executes trades on behalf of customers.
8. Are Barchart’s market signals guaranteed to be accurate?
No. Market indicators and analytical signals are based on available data and particular methodologies. They can be incorrect or misleading and should not be treated as guarantees of future performance.
9. Do we need a paid Barchart subscription?
Not necessarily. The free features may be adequate for basic research. A paid subscription is worth evaluating only when its additional tools provide value for specific research needs.
10. Where can we access Barchart?
The platform is available through its official website: https://www.barchart.com/.
Conclusion
Barchart is a comprehensive financial market research platform that brings together stock information, interactive charts, technical indicators, screening tools, futures prices, commodity data, and options research. Its broad coverage makes it a useful resource for people who want to understand financial markets and organize their research more efficiently.
The platform can support beginners who are learning about financial data as well as experienced users who need more specialized analytical resources. However, its features are most valuable when users understand the information being presented and recognize the limitations of market indicators.
By choosing relevant tools, verifying important data, learning basic financial concepts, and approaching market analysis carefully, we can make better use of Barchart for research and education. Ultimately, informed financial decisions depend on sound judgment, reliable information, and a clear understanding of risk, not on any single website or analytical tool.